

Common · Literature
Forest plot
Graphical visualization
A forest plot, also known as a blobbogram, is a graphical display of estimated results from a number of scientific studies addressing the same question, along with the overall results. It was developed for use in medical research as a means of graphically representing a meta-analysis of the results of randomized controlled trials.
From Wikipedia
A forest plot, also known as a blobbogram, is a graphical display of estimated results from a number of scientific studies addressing the same question, along with the overall results. It was developed for use in medical research as a means of graphically representing a meta-analysis of the results of randomized controlled trials. In the last twenty years, similar meta-analytical techniques have been applied in observational studies (e.g. environmental epidemiology) and forest plots are often used in presenting the results of such studies also. Although forest plots can take several forms, they are commonly presented with two columns. The left-hand column lists the names of the studies (frequently randomized controlled trials or epidemiological studies), commonly in chronological order from the top downwards. The right-hand column is a plot of the measure of effect (e.g. an odds ratio) for each of these studies (often represented by a square) incorporating confidence intervals represented by horizontal lines. The graph may be plotted on a natural logarithmic scale when using odds ratios or other ratio-based effect measures, so that the confidence intervals are symmetrical about the means from each study and to ensure undue emphasis is not given to odds ratios greater than 1 when compared to those less than 1. The area of each square is proportional to the study's weight in the meta-analysis. The overall meta-analysed measure of effect is often represented on the plot as a dashed vertical line. This meta-analysed measure of effect is commonly plotted as a diamond, the lateral points of which indicate confidence intervals for this estimate. A vertical line representing no effect is also plotted. If the confidence intervals for individual studies overlap with this line, it demonstrates that at the given level of confidence their effect sizes do not differ from no effect for the...
Text: Wikipédia, CC BY-SA 4.0. · Image: James Grellier (CC BY-SA 3.0) ·
Related cards
-
T★★
Technology tree
Diagram used in strategy computer games
-
 ★★
★★
Thoughtography
Claimed psychic ability
-
 ★
★
Ornithogalum arabicum
Species of plant
-
 ★★★
★★★
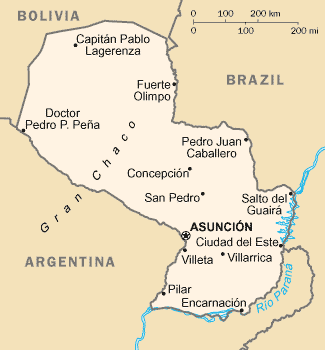
Geography of Paraguay
Overview of the geography of Paraguay
-
 ★★
★★
SIGGRAPH
ACM annual conference series on computer graphics
-
 ★
★
Shmoo plot
Chart
-
 ★★
★★
Graptopetalum paraguayense
Species of plant
-
 ★★
★★
Flora Brasiliensis
Book by Carl Friedrich Philipp von Martius
-
C★
Cohort analysis
Behavioral analytics that breaks the data in a data set into related groups before analysis
-
 ★
★
Gram per cubic centimetre
SI unit of density
-
 ★★
★★
Diaphragm (optics)
Optics and photography
-
 ★
★
Strongly regular graph
Graph in which the number of shared neighbors of two vertices depends only on whether they are adjacent
-
 ★★
★★
Allometry
Study of the relationship of body size to shape, anatomy, physiology, and behavior
-
 ★★★
★★★
Araucaria moist forests
Coniferous forest ecoregion of the Atlantic Forest Biome in South America
-
 ★
★
Estimation
Process of finding an estimate, or approximation, which is a value that is usable for some purpose even if input data may be incomplete, uncertain, or unstable
-
M★
Ministério da Agricultura e Florestas
-
 ★
★
BioLib
Online taxonomic encyclopedia
-
 ★★
★★
Full width at half maximum
Concept in statistics and wave theory