

Commune · Littérature
Pole–zero plot
In mathematics, signal processing and control theory, a pole–zero plot is a graphical representation of a rational transfer function in the complex plane which helps to convey certain properties of the system such as: Stability Causal system / anticausal system Region of convergence (ROC) Minimum phase / non minimum phase A pole-zero plot shows the location in the complex plane of the poles and zeros of the transfer function of a dynamic system, such as a controller, compensator, sensor, equalizer, filter, or communications channel. By conventi...
Sur Wikipédia
Texte en anglais Pas encore d'article dans ta langue : extrait en anglais.
In mathematics, signal processing and control theory, a pole–zero plot is a graphical representation of a rational transfer function in the complex plane which helps to convey certain properties of the system such as: Stability Causal system / anticausal system Region of convergence (ROC) Minimum phase / non minimum phase A pole-zero plot shows the location in the complex plane of the poles and zeros of the transfer function of a dynamic system, such as a controller, compensator, sensor, equalizer, filter, or communications channel. By convention, the poles of the system are indicated in the plot by an X while the zeros are indicated by a circle or O. A pole-zero plot is plotted in the plane of a complex frequency domain, which can represent either a continuous-time or a discrete-time system: Continuous-time systems use the Laplace transform and are plotted in the s-plane: s = σ + j ω {\displaystyle s=\sigma +j\omega } Real frequency components are along its vertical axis (the imaginary line s = j ω {\displaystyle s{=}j\omega } where σ = 0 {\displaystyle \sigma {=}0} ) Discrete-time systems use the Z-transform and are plotted in the z-plane: z = A e j ϕ {\displaystyle z=Ae^{j\phi }} Real frequency components are along its unit circle
Texte : Wikipédia en anglais, CC BY-SA 4.0. ·
Cartes voisines
-
 ★
★
Radar d'approche de précision
Type de dispositif radar
-
 ★★
★★
Signalisation différentielle
Méthode de transmission de signal électrique
-
 ★★★
★★★
Valeur propre, vecteur propre et espace propre
Notions caractérisant la dilation d'un endomorphisme, d'une matrice, facilitant leur étude
-
c★
conjecture de Poincaré généralisée
Topological conjecture
-
 ★
★
Percolation threshold
Threshold of percolation theory models
-
 ★
★
Projection sinusoïdale
Projection cartographique
-
 ★★
★★
Symétrie (physique)
Invariance d'un système par différents points de vue
-
 ★★
★★
Processus de Poisson
Processus de comptage classique en mathématique
-
 ★★
★★
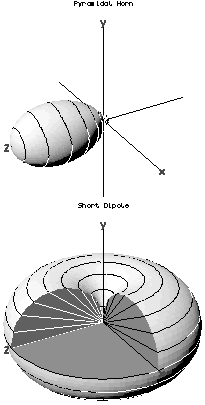
Diagramme de rayonnement
-
 ★★
★★
Fonction linéaire (analyse)
Fonction mathématique traduisant la proportionnalité
-
 ★
★
Théorème de Mittag-Leffler
Théorème qui montre l’existence de fonctions méromorphes avec des pôles prescrits
-
C★★★★
Conjecture jacobienne
-
A★★
Analyse de sensibilité
Type d'analyse
-
W★
Whittaker–Shannon interpolation formula
Signal (re-)construction algorithm
-
 ★★★
★★★
Théorème d'échantillonnage
-
 ★
★
Pylon turn
Flight maneuver in which an aircraft banks into a circular turn around a fixed spot on the ground
-
 ★
★
Variogramme
-
P★
Polynôme minimal d'un endomorphisme
Polynôme unitaire de degré minimal annulant un endomorphisme